When returning from a swim in the ocean, sometimes it seems as though your towel has moved. Of course, it’s just that the water line has shifted.
The natural rise and fall of the ocean at the beach is an excellent demonstration of gravitational forces exerted by the Sun and the Moon. Although the tidal force is small, it is strong enough to pull regularly on the ocean, making an enormous volume of water rise and fall.
What you might not know is that tidal forces from the Sun and Moon also influence the air we breathe and the solid ground we stand on. These effects are referred to as atmospheric and Earth tides.
While we don’t tend to notice Earth and atmospheric tides, they do affect both the land and the world’s largest freshwater resource located underneath our feet: groundwater. This occupies the pores that exist in geological materials such as sand or soil, much like water in a kitchen sponge.
We have developed a method that incorporates tidal influences to monitor our precious groundwater resources without the need for pumping, drilling or coring.
Water beneath our feet
It has been estimated that groundwater makes up 99% of the usable freshwater on Earth. If all of Earth’s groundwater were extracted and pooled across the world’s land surface, it would be enough to create a lake 180 metres deep.
While this sounds like a lot of water, it is important to remember that not all groundwater is available for use. In fact, groundwater is currently mined on a global scale, especially in drier parts of the world, where groundwater underpins human activities during times of drought.
Groundwater extraction can lead to a downward shift in the land surface level (known as “subsidence”), particularly if groundwater is removed from underground zones that contain soft clays. This is a significant global problem, especially in coastal areas, due to urbanisation and associated water demand.
Alternatively, a long wet period with excess rainfall can cause the groundwater to rise up and cause flooding.
Effect of tides on groundwater
Deeper groundwater buried underneath layers of different types of sediments is under great pressure (in groundwater terminology this is called “confined”). The gravity change from Earth tides squeezes the sediment, and therefore changes the pressure of the water in the pores.
The atmospheric tides add to the weight that is sitting on top of the groundwater and cause a change in stress that results in a downward squeezing.
Groundwater at that depth responds to these stress changes, which can be measured as tiny water level fluctuations inside a groundwater borehole.
We have developed a new approach that exploits these tidal influences to calculate important subsurface properties. For example, this can predict how the pressure is lowered when groundwater is pumped, and by how much the land surface would sink as a result of shrinking subsurface material (just like squeezing a kitchen sponge).
The method basically allows accurate calculation of the compressible subsurface properties from the groundwater response to Earth and atmospheric tides.
This development is significant because it will allow analyses of a subsurface water reservoir (called an aquifer) without human-induced stresses such as pumping or taking physical samples of the material through drilling or coring in addition to constructing a borehole.
All that’s needed for this analysis is a roughly 16-day period of continuous measurements of groundwater levels and atmospheric pressure at hourly intervals.
Groundwater levels are routinely recorded as part of water monitoring programs around the world and in Australia, as funded by the Federal Government groundwater NCRIS scheme. Atmospheric pressure is a standard parameter measured by weather stations, such as operated by the Bureau of Meteorology.
The effects of tidal forces on groundwater might be less apparent to us than their effects on the ocean, but they’re just as important. Our new method of understanding the influence of tides on groundwater significantly reduces the effort to predict the response to groundwater pumping and the potential for land subsidence.
Tokyo, Moscow, Madrid, London, Brussels, and now St Petersburg. These major cities have all suffered attacks on their metro systems. The most recent events in St Petersburg, where a metro bombing killed at least 14 people, remind us of the challenges faced by underground transport systems in keeping people safe during an emergency. This is where engineering and psychology research can come in useful, helping to optimise evacuation procedures using insight into how people behave.
To start with, there are several key ways that evacuating an underground system differs from evacuating a building. Underground environments are often unfamiliar to the evacuees, especially if the evacuation has to start in the tunnels between stations. The system’s enclosed nature also means visibility can rapidly deteriorate from smoke. Tunnels are generally not divided into separate sections to stop smoke spreading, which allows it to rapidly fill all spaces.
This can cause a number of problems when it comes to evacuating passengers. Evacuation slows down when visibility is poor and people cannot fully rely on what they can see to help them get out. Smoke can also obscure signs and other visual instructions, making it difficult for people to locate the closest emergency exit. For this reason, evacuees often rely on alternative senses such as hearing or touch to find their way to safety. This is why auditory alarms and hand rails can be much more useful.
Another reason these kind of guides and information are needed is because people tend to move towards familiar places or people in an emergency. For example, if someone is looking for a way out of a metro system, they may well try to get back to where they came in. But in many instances, closer emergency exits may be available in the tunnels. These exits often lead to safety in a significantly shorter time.
Similarly, people’s attention can narrow to focus on immediate threats rather than analysing all the information available to them, especially when they are under pressure to escape as quickly as possible. This is where social influence can come in. If one person can find a quicker evacuation route, their interaction with other evacuees can help spread this information and help everyone get out quicker.
St Petersburg aftermath.megapolisonline.ru/EPA
At a more fundamental level, the design of the tunnels and trains can lead to significant safety improvements. Experimental research has shown the effectiveness of an evacuation from a metro train depends on the configuration of the train door and the space available after getting out of it. This can include the presence of a height gap between the train doors and the outside floor and narrow spaces for evacuation in the tunnels.
The height gap in particular, which can be up to 1.4 metres, can be a major obstacle during evacuation, slowing down the flow of people out of the train. It may also mean that some evacuees, particularly children and older people, may not be able to evacuate on their own. This height difference can make it even more important that the driver manages to get the train to a station, as the driver in the St Petersburg attack did – despite the fact the bomb went off inside a tunnel. This likely led to a quicker evacuation and less severe consequences.
In fact, people often tend to help each other in emergencies, including during metro train evacuations. For example, footage from the St Petersburg bombing shows people trying to help others get out of the attacked trains, and similar altruistic behaviours have been observed in several other disasters. So whatever preparations metro authorities make for disasters, they can consider their passengers to be part of their solution. They need to design the tunnel environment for the people, not the people for the environment.
Statistics is a useful tool for understanding the patterns in the world around us. But our intuition often lets us down when it comes to interpreting those patterns. In this series we look at some of the common mistakes we make and how to avoid them when thinking about statistics, probability and risk.
You don’t have to wait long to see a headline proclaiming that some food or behaviour is associated with either an increased or a decreased health risk, or often both. How can it be that seemingly rigorous scientific studies can produce opposite conclusions?
Nowadays, researchers can access a wealth of software packages that can readily analyse data and output the results of complex statistical tests. While these are powerful resources, they also open the door to people without a full statistical understanding to misunderstand some of the subtleties within a dataset and to draw wildly incorrect conclusions.
Here are a few common statistical fallacies and paradoxes and how they can lead to results that are counterintuitive and, in many cases, simply wrong.
Simpson’s paradox
What is it?
This is where trends that appear within different groups disappear when data for those groups are combined. When this happens, the overall trend might even appear to be the opposite of the trends in each group.
One example of this paradox is where a treatment can be detrimental in all groups of patients, yet can appear beneficial overall once the groups are combined.
How does it happen?
This can happen when the sizes of the groups are uneven. A trial with careless (or unscrupulous) selection of the numbers of patients could conclude that a harmful treatment appears beneficial.
Example
Consider the following double blind trial of a proposed medical treatment. A group of 120 patients (split into subgroups of sizes 10, 20, 30 and 60) receive the treatment, and 120 patients (split into subgroups of corresponding sizes 60, 30, 20 and 10) receive no treatment.
The overall results make it look like the treatment was beneficial to patients, with a higher recovery rate for patients with the treatment than for those without it.
However, when you drill down into the various groups that made up the cohort in the study, you see in all groups of patients, the recovery rate was 50% higher for patients who had no treatment.
But note that the size and age distribution of each group is different between those who took the treatment and those who didn’t. This is what distorts the numbers. In this case, the treatment group is disproportionately stacked with children, whose recovery rates are typically higher, with or without treatment.
Base rate fallacy
What is it?
This fallacy occurs when we disregard important information when making a judgement on how likely something is.
If, for example, we hear that someone loves music, we might think it’s more likely they’re a professional musician than an accountant. However, there are many more accountants than there are professional musicians. Here we have neglected that the base rate for the number of accountants is far higher than the number of musicians, so we were unduly swayed by the information that the person likes music.
How does it happen?
The base rate fallacy occurs when the base rate for one option is substantially higher than for another.
Example
Consider testing for a rare medical condition, such as one that affects only 4% (1 in 25) of a population.
Let’s say there is a test for the condition, but it’s not perfect. If someone has the condition, the test will correctly identify them as being ill around 92% of the time. If someone doesn’t have the condition, the test will correctly identify them as being healthy 75% of the time.
So if we test a group of people, and find that over a quarter of them are diagnosed as being ill, we might expect that most of these people really do have the condition. But we’d be wrong.
In a typical sample of 300 patients, for every 11 people correctly identified as unwell, a further 72 are incorrectly identified as unwell.The Conversation, CC BY-ND
According to our numbers above, of the 4% of patients who are ill, almost 92% will be correctly diagnosed as ill (that is, about 3.67% of the overall population). But of the 96% of patients who are not ill, 25% will be incorrectly diagnosed as ill (that’s 24% of the overall population).
What this means is that of the approximately 27.67% of the population who are diagnosed as ill, only around 3.67% actually are. So of the people who were diagnosed as ill, only around 13% (that is, 3.67%/27.67%) actually are unwell.
Worryingly, when a famous study asked general practitioners to perform a similar calculation to inform patients of the correct risks associated with mammogram results, just 15% of them did so correctly.
Will Rogers paradox
What is it?
This occurs when moving something from one group to another raises the average of both groups, even though no values actually increase.
The name comes from the American comedian Will Rogers, who joked that “when the Okies left Oklahoma and moved to California, they raised the average intelligence in both states”.
Former New Zealand Prime Minister Rob Muldoon provided a local variant on the joke in the 1980s, regarding migration from his nation into Australia.
How does it happen?
When a datapoint is reclassified from one group to another, if the point is below the average of the group it is leaving, but above the average of the one it is joining, both groups’ averages will increase.
Example
Consider the case of six patients whose life expectancies (in years) have been assessed as being 40, 50, 60, 70, 80 and 90.
The patients who have life expectancies of 40 and 50 have been diagnosed with a medical condition; the other four have not. This gives an average life expectancy within diagnosed patients of 45 years and within non-diagnosed patients of 75 years.
If an improved diagnostic tool is developed that detects the condition in the patient with the 60-year life expectancy, then the average within both groups rises by 5 years.
Berkson’s paradox can make it look like there’s an association between two independent variables when there isn’t one.
How does it happen?
This happens when we have a set with two independent variables, which means they should be entirely unrelated. But if we only look at a subset of the whole population, it can look like there is a negative trend between the two variables.
This can occur when the subset is not an unbiased sample of the whole population. It has been frequently cited in medical statistics. For example, if patients only present at a clinic with disease A, disease B or both, then even if the two diseases are independent, a negative association between them may be observed.
Example
Consider the case of a school that recruits students based on both academic and sporting ability. Assume that these two skills are totally independent of each other. That is, in the whole population, an excellent sportsperson is just as likely to be strong or weak academically as is someone who’s poor at sport.
If the school admits only students who are excellent academically, excellent at sport or excellent at both, then within this group it would appear that sporting ability is negatively correlated with academic ability.
To illustrate, assume that every potential student is ranked on both academic and sporting ability from 1 to 10. There are an equal proportion of people in each band for each skill. Knowing a person’s band in either skill does not tell you anything about their likely band in the other.
Assume now that the school only admits students who are at band 9 or 10 in at least one of the skills.
If we look at the whole population, the average academic rank of the weakest sportsperson and the best sportsperson are both equal (5.5).
However, within the set of admitted students, the average academic rank of the elite sportsperson is still that of the whole population (5.5), but the average academic rank of the weakest sportsperson is 9.5, wrongly implying a negative correlation between the two abilities.
This is where unexpected trends can occur through random chance alone in a data set with a large number of variables.
How does it happen?
When looking at many variables and mining for trends, it is easy to overlook how many possible trends you are testing. For example, with 1,000 variables, there are almost half a million (1,000×999/2) potential pairs of variables that might appear correlated by pure chance alone.
While each pair is extremely unlikely to look dependent, the chances are that from the half million pairs, quite a few will look dependent.
Example
The Birthday paradox is a classic example of the multiple comparisons fallacy.
In a group of 23 people (assuming each of their birthdays is an independently chosen day of the year with all days equally likely), it is more likely than not that at least two of the group have the same birthday.
People often disbelieve this, recalling that it is rare that they meet someone who shares their own birthday. If you just pick two people, the chance they share a birthday is, of course, low (roughly 1 in 365, which is less than 0.3%).
However, with 23 people there are 253 (23×22/2) pairs of people who might have a common birthday. So by looking across the whole group you are testing to see if any one of these 253 pairings, each of which independently has a 0.3% chance of coinciding, does indeed match. These many possibilities of a pair actually make it statistically very likely for coincidental matches to arise.
For a group of as few as 40 people, it is almost nine times as likely that there is a shared birthday than not.
The probability of no shared birthdays drops as the number of people in a group increases.The Conversation, CC BY-ND
It was Apicius, the Roman gourmand, who came up with the line that “the first taste is with the eyes”. The latest research from the emerging field of gastrophysics shows that he was absolutely right. Our brains evolved to help us find food – and making food look more visually appealing can prime expectations and therefore enhance the taste.
It isn’t just the sight of the food, though – you should see, hear, smell and touch food as well if you are going to make enough of a meal of a dining experience. Here are a few ways in which our senses can conspire to make food more of an experience.
Heston Blumenthal’s Sounds of the Sea seafood dish.Sergio Coimbra, CC BY
Think about the plate
Research shows that we rate food as tasting different depending on the colour of the crockery on which it is served. We conducted an experiment at Ferran Adria’s Alicia Foundation just outside Barcelona a few years ago in which we demonstrated that people would rate a pinkish strawberry mousse as tasting 7% sweeter, 13% more flavourful and 9% more enjoyable when it was served it on a white plate rather than a black plate. Meanwhile, others have demonstrated that we will eat less junk food if it is served from a red plate than from a plate of any other colour.
But it isn’t just the colour of the plate that affects our food behaviour and flavour perception; it is also the shape. Several studies have shown that people rate food as tasting sweeter if it’s served off a round plate than a more angular plate. So, for anyone with a sweet tooth, the recommendation from the gastrophysics lab is that you should save the angular black slate for the cheese.
Think about the cutlery
In order to get the food from the plate to our mouths, most of us use cutlery. But just how much thought have any of us given to the cold smooth hard metal that we put in our mouths several times every day? The latest gastrophysics research shows that food tastes better – and we are willing to pay more for it – if we eat with heavier cutlery. Adding texture to the handle or spoon of the cutlery can also make for a more enjoyable, more stimulating, and definitely a more memorable tasting experience.
It’s results such as these, collected from both the science lab and also from the comments of real diners in restaurants, that help explain the why Heston Blumenthal gave diners a heavy furry-handled spoon to eat the last course of “Counting Sheep” at his Fat Duck restaurant in Bray.
Comfort cutlery? The furry spoon designed to eat Heston Blumenthal’s food.Author provided
It is amazing to see all the new cutlery designs that are being developed. But some chefs in top restaurants – such as the two Michelin-starred Mugaritz in San Sebastian, Spain, and at the Chef’s Table by Kitchen Theory in London – are going even further and putting out dishes that are specifically designed to be eaten with the hands.
Think about the music
Sound really is the forgotten flavour sense. Enhance the sound of the crunch and people think that crisps taste crisper and fresher. This is the groundbreaking research that got us the IG Nobel Prize for Nutrition back in 2008. However, beyond the sound of the food itself, have you ever wondered why crisps so often come in noisy packets? It turns out that that too is part of “the experience”. Noisier crisp packets also make foods appear crisper – as we showed in research with Heston that was reported in 2011.
However, one of the most intriguing ways in which what we hear affects what we taste relates to the emerging field of sonic seasoning. For it turns out that playing tinkling high-pitched music brings out the sweetness in food and drink, while low-pitched brassy music accentuates bitterness instead. We have now identified the kinds of music that will bring out sourness, spiciness, and even accentuate the creaminess of a chocolate.
It may seem crazy, but the business world really is starting to sit up and listen. For instance, British Airways launched a “sound bite” menu, long-haul meals with matching musical accompaniment back in 2014. Meanwhile, a café in Vietnam just opened playing lots of sweet music to help people reduce their sugar intake.
Think about the lighting
You should also think about the lighting when you eat. Research from the US shows that people who like “strong coffee” drink more of the stuff under bright lighting, while increasing the brightness of the lighting can also nudge people toward ordering spicier chicken wings. In our own research, testing more than 3,000 people, we showed that we could enhance the fruitiness of a red wine (served in a black tasting glass) by around 15% simply by putting on some red lights, rather than regular white, or green lighting instead. Adding some of that sweet music in the background made the effects even more pronounced.
Put all the research together – and you can read about this in my recent book – and what some have been tempted to call “off-the-plate” dining can, I firmly believe, help us all to create more enjoyable, tastier, healthier, and more memorable meals.
It was Apicius, the Roman gourmand, who came up with the line that “the first taste is with the eyes”. The latest research from the emerging field of gastrophysics shows that he was absolutely right. Our brains evolved to help us find food – and making food look more visually appealing can set better expectation and so enhance the taste.
It isn’t just the sight of the food, though – you should see, hear, smell and touch food as well if you are going to make enough of a meal of a dining experience. Here are a few ways in which our senses can conspire to make food more of an experience.
Heston Blumenthal’s Sounds of the Sea seafood dish.Sergio Coimbra, CC BY
Think about the plate
Research shows that we rate food as tasting different depending on the colour of the crockery on which it is served. We conducted an experiment at Ferran Adria’s Alicia Foundation just outside Barcelona a few years ago in which we demonstrated that people would rate a pinkish strawberry mousse as tasting 7% sweeter, 13% more flavourful and 9% more enjoyable when it was served it on a white plate rather than a black plate. Meanwhile, others have demonstrated that we will eat less junk food if it is served from a red plate than from a plate of any other colour.
But it isn’t just the colour of the plate that affects our food behaviour and flavour perception; it is also the shape. Several studies have shown that people rate food as tasting sweeter if it’s served off a round plate than a more angular plate. So, for anyone with a sweet tooth, the recommendation from the gastrophysics lab is that you should save the angular black slate for the cheese.
Think about the cutlery
In order to get the food from the plate to our mouths, most of us use cutlery. But just how much thought have any of us given to the cold smooth hard metal that we put in our mouths several times every day? The latest gastrophysics research shows that food tastes better – and we are willing to pay more for it – if we eat with heavier cutlery. Adding texture to the handle or spoon of the cutlery can also make for a more enjoyable, more stimulating, and definitely a more memorable tasting experience.
It’s results such as these, collected from both the science lab and also from the comments of real diners in restaurants, that help explain the why Heston Blumenthal gave diners a heavy furry-handled spoon to eat the last course of “Counting Sheep” at his Fat Duck restaurant in Bray.
Comfort cutlery? The furry spoon designed to eat Heston Blumenthal’s food.Author provided
It is amazing to see all the new cutlery designs that are being developed. But some chefs in top restaurants – such as the two Michelin-starred Mugaritz in San Sebastian, Spain, and at the Chef’s Table by Kitchen Theory in London – are going even further and putting out dishes that are specifically designed to be eaten with the hands.
Think about the music
Sound really is the forgotten flavour sense. Enhance the sound of the crunch and people think that crisps taste crisper and fresher. This is the groundbreaking research that got us the IG Nobel Prize for Nutrition back in 2008. However, beyond the sound of the food itself, have you ever wondered why crisps so often come in noisy packets? It turns out that that too is part of “the experience”. Noisier crisp packets also make foods appear crisper – as we showed in research with Heston that was reported in 2011.
However, one of the most intriguing ways in which what we hear affects what we taste relates to the emerging field of sonic seasoning. For it turns out that playing tinkling high-pitched music brings out the sweetness in food and drink, while low-pitched brassy music accentuates bitterness instead. We have now identified the kinds of music that will bring out sourness, spiciness, and even accentuate the creaminess of a chocolate.
It may seem crazy, but the business world really is starting to sit up and listen. For instance, British Airways launched a “sound bite” menu, long-haul meals with matching musical accompaniment back in 2014. Meanwhile, a café in Vietnam just opened playing lots of sweet music to help people reduce their sugar intake.
Think about the lighting
You should also think about the lighting when you eat. Research from the US shows that people who like “strong coffee” drink more of the stuff under bright lighting, while increasing the brightness of the lighting can also nudge people toward ordering spicier chicken wings. In our own research, testing more than 3,000 people, we showed that we could enhance the fruitiness of a red wine (served in a black tasting glass) by around 15% simply by putting on some red lights, rather than regular white, or green lighting instead. Adding some of that sweet music in the background made the effects even more pronounced.
Put all the research together – and you can read about this in my recent book – and what some have been tempted to call “off-the-plate” dining can, I firmly believe, help us all to create more enjoyable, tastier, healthier, and more memorable meals.
As Brexit looms, Earth scientists have uncovered evidence of Britain’s original split from mainland Europe. Almost half a million years ago, according to new data, water suddenly started cascading over the narrow strip of land that joined England and France – putting pressure on a chalk bridge.
Researchers show that, as a result, this ridge – a natural dam that separated the North Sea from the English Channel – was catastrophically ruptured hundreds of thousands of years later in a two-stage process, ultimately setting Britain’s insular environment in stone. Their results are reported in Nature Communications.
So where did all the water that caused this geological disaster come from? The scientists, from UK, Belgium and France, base their conclusions on a line of deep plunge pools (basins excavated by intense waterfalls) and a network of channels cut in the sea floor south-west of the ridge line. They deduce that these were first formed some 450,000 years ago as a lake of glacial melt water to the north-east in the North Sea basin (the depression where the north sea sits today, some of which was dry land back then) spilled over into what is today the English Channel.
However, exactly why the glacial lake suddenly spilt over remains unknown. One possibility is that part of its ice sheet broke off, causing a surge that prompted the water to flow over. The 33km long land bridge at Dover Strait formed part of an icy landscape at the time. According to the researchers, it looked “more like the frozen tundra in Siberia than the green environment we know today”.
3D view of the seafloor in the 33km wide Dover Strait showing a prominent valley in the central part.Imperial College London/Professor Sanjeev Gupta and Dr Jenny Collier
The loose gravel that fills the seafloor plunge pools was first noticed 50 years ago. Indeed, the channel tunnel had to be rerouted to avoid them during its construction. There has long been speculation that they were associated with the remains of the land bridge that formed an ancient route between UK and Europe – and now we finally have some evidence to back this up.
The plunge pools themselves are huge, drilling down some 100 metres into the solid bedrock and measuring several kilometres across. The waterfalls that formed them are estimated to have been 100 metres high, as we know the land bridge stood high above the surrounding landscape.
Second sudden destruction
It seems Dover Strait may have gone through two breaches. The first one, about 450,000 years ago, was rather modest and formed a smaller channel than the one we see today. But the authors suggest that a second, more catastrophic breach subsequently occurred – possibly hundreds of thousands of year later, irrevocably separating Britain from Europe.
3D view of an ancient large waterfall in a valley in the central part of Dover Strait. A plunge pool lies at its base.Imperial College London/Professor Sanjeev Gupta and Dr Jenny Collier
This final collapse of the land bridge is marked out by a larger seafloor channel named the Lobourg Channel, which cuts through the earlier structures. This appears to have been carved by a major cataclysmic flood from the North Sea into the English Channel. The timings of the two-stage erosion, including the final destruction of the connecting bridge, are uncertain, but mollusc shells found either side of the breach indicate that it was complete at least 100,000 years ago.
The latest observations are the result of a broad marine geophysics campaign to tackle the problem. Ship-based seismic surveys of the floor of the English Channel have been combined with a type of sonar to provide an astoundingly detailed picture of the sea floor and its sub-surface. Uncertainty remains over the exact timings of each of the events, and researchers have set their sights on drilling into the sea floor to retrieve samples from the plunge pool sediments to determine their precise ages.
The erosion of the land bridge hundreds of thousands of years ago set Britain on its path to becoming an island nation. Subsequent changes in sea level at the end of that ancient ice age further confirmed its insularity, and Britain’s connection to mainland Europe was lost.
Exactly when did human beings start tipping their weapons with poison to hunt prey? This is a question at the forefront of recent archaeological research.
In southern Africa San (or Bushman) hunter-gatherer groups, such as the /Xam of the Western Cape and the Ju/wasi and Hei//om of Namibia, used poisoned arrows for hunting during the 19th and 20th centuries. The origins of this technology, though, may be far older than we thought.
Recently, traces of the poison ricin were found on a 24 000 year-old wooden poison applicator at Border Cave in South Africa’s Lebombo mountains. If this identification is correct it would mean that people in southern Africa were among the first in the world to harness the potential of plant-based poisons.
South Africa has provided plenty of evidence of behaviours that could be attributed to cognitively complex Homo sapiens. This includes early evidence of hafted projectile technology, the selection of aromatic plants for bedding materials), and the use of ochre as an insect repellent.
The early use of poison is one more indicator of an advanced repertoire of behavioural and technological traits that have characterised our species from the earliest times. The problem is that it’s not easy to identify the remnants of ancient poisons. Organic molecules, including those that make up different poisons, degrade over time and seldom resemble their parent compound. For this reason it is often very difficult to accurately identify ancient organic residues.
Now a team of archaeologists and organic chemists from the Universities of the Witwatersrand, Pretoria and Johannesburg has published details of a method that can – with reasonable accuracy – identify plant-based toxins and other unique chemical markers present on archaeological artefacts .
This may allow scientists to infer the presence of toxic plant ingredients applied to ancient weapons. It adds to our growing appreciation of the full complexity of early human populations – in southern Africa as well as in the world.
Testing the method
Anyone who’s watched BBC nature documentaries will recall scenes of small groups of Bushman hunting antelope with their delicate little bows and arrows. This flimsy equipment was able to bring down large game because of poison.
The most well known source of arrow poison in southern Africa is a beetle larva known as Diamphidia. The Diamphidia grub is still used today by traditional hunters living in the Kalahari. The grub is eviscerated between the hunter’s fingers and its entrails applied directly to an arrowhead’s base. The poison, known as diamphotoxin, can bring down a fully-grown giraffe.
But historical records indicate that many other, different plant ingredients were used. The particular ingredients and recipes used to make arrow poison differed between groups and locations.
A recent archaeological discovery at Border Cave (on South Africa’s border with Swaziland), revealed trace amounts of a substance still adhering to a 24 000 year-old wooden poison applicator. This substance was identified as by-products of the poison ricin. Ricin is produced by the castor bean plant, from which castor oil originates. This discovery, though not without its detractors, sparked renewed interest in identifying poison ingredients on archaeological artefacts in various parts of the world.
This is where our research comes in.
Our paper presented the results of a pilot study designed to accurately detect minute amounts of organic compounds from poisonous plants found on archaeological artefacts. We used an analytical technique known as ultra performance liquid chromatography – mass spectrometry (UPLC-MS) – to characterise the organic compounds present in 11 species of poisonous plant found in southern Africa.
To test the reliability of our detection technique and our ability to accurately identify the most likely plant source of identified compounds, we conducted a blind test. Three plant extracts were prepared following a known poison recipe and applied to a modern arrowhead. The plants used in this recipe were known to only one of the authors. Once the poison coating on the arrowhead had dried, a small amount was scraped off and analysed using UPLC-MS.
We were able to identify two of the three plants used in the poison recipe; identification of the third, belonging to the euphorbia taxa, was not definitive.
Finally, a 90-year-old poisoned arrowhead from Namibia was analysed following the same protocol. The results showed that our method can be used tentatively to identify toxins based on comparative overlays with fresh plant material. Furthermore, the method is able to identify non-toxic compounds that may be unique to specific species of plants. This means the plant in question could be identified even in the absence of known toxins.
Opening new doors
Our study’s importance lies in the ability to recognise organic components of ancient plant-based poisons that may be hundreds – or even thousands – of years old. This is particularly impressive in instances where several ingredients were mixed together to prepare an arrow poison and where only minute amounts of this poison survive on the implement.
No historical information exists on the variety of plants used (nor, indeed, the recipes) for arrow poisons in the eastern half of southern Africa. Also, apart from the single discovery at Border Cave, we have no idea when people started using poisons to assist in hunting. Hopefully this new method can help to address both of these issues and build on existing scholarship of Africa’s indigenous knowledge systems.
The Conversation Global’s series, Politics in the Age of Social Media, examines how governments around the world rely on digital tools to exercise power.
Latin American democracy was born with an original sin: income inequality – the highest in the world. Thus it was that the region’s democratic institutions originated in a context of severe social exclusion and poverty.
The US-style Madisonian model of democracy implemented across the region as its prevailing dictatorships ended in the 1980s – characterised by general elections, separation of powers, built-in checks and balances and civil control of the armed forces – did not match most Latin American nations’ cultural identities.
That disconnect left significant gaps in governments’ ability to connect with and serve their people. Though democracy in Latin America is young, these fundamental structural problems have remained unsolved for 30 years, and they partially explain the region’s numerous current socio-political crises, from Brazil and Venezuela to Mexico.
The late Hugo Chávez was an early adopter of Twitter, launching an account in 2010 to combat online opponents.Jorge Silva/Reuters
Fill the vacuum (and the airwaves)
In the crowded Twittersphere, the presidents of Venezuela and Ecuador are standouts – both for their large followings and continuous activity.
Venezuela’s Nicolás Maduro, for instance, has over three million followers. His account exhibits his entire presidential platform, daily commitments, and “personal” relationships with constituents, from messages railing against the Organisation of American States to the unveiling of public works.
Both Maduro and Correa frequently appear on television reading the tweets they’ve received, mentioning by name – for better or for worse – those who’ve sent them messages. The citizen, who is now also the spectator, in turn feels he has been served, made part of the political game, become visible.
The president of Venezuela, trolling a Twitter troll on television.
A governance crisis
Politics is not just about running the government, it’s also about creating opportunities for citizens to realise their aspirations. Because Latin American democracy was, in most cases, rolled out without a robust consultative process, decent education system or a plan to address structural poverty, it’s systematically exclusionary.
The silenced voices of the rural poor, indigenous communities, women and those unable to read, were not heard or considered when creating and implementing public policies. As a result, governments today struggle to respond to the demands of many social sectors.
There are two ways to fill this gap. The first is suppression via the use of force. Though this is fairly common in Latin America, as an official policy it undermines state legitimacy.
The other option is to create new mechanisms for state-society relations. Latin American leaders, then, are using social media to engage with the electorate because their democratic institutions – fragile and insufficient – are not able to effectively receive, process and address citizen demands.
This direct communication redefines the governor-governed relationship, creating an imagined social interaction in which the political leader is “bound” to his subject by virtue of recognising a tweet. With Twitter, the ordinary person may believe that she has sent a message directly to a person in power, informing them of something they did not know. She may feel less anonymous, more emboldened and capable of navigating the complexities of government bureaucracy.
But Twitter engagement is not (re)constructing republic-style citizenship in Latin America. Rather, it is building an artificial relationship derived from the notion that power dynamics between citizens and politicians have been eliminated.
Direct digital interlocution with a president creates what Polish sociologist and philosopher Zygmunt Bauman would call a false sense of community.
Nicolás Maduro, Venezuela’s president, greets fans (citizens) before his regular radio show, ‘In Contact with Maduro’.Reuters
This process also implies clientelism, turning presidents into patrons and citizens into clients. Most Tweets and Facebook messages to Latin American leaders are petitions or requests – people asking the all-powerful leader to fix problems with public services or provide financial assistance.
Perverse mechanisms, broken system
The problem is that the way this works undermines the legitimate mechanisms of government. Making the masses dependent on digital communication with a specific leader leaves existing institutional dynamics and control mechanisms entirely out of the process.
When a crime is reported to the president, what role have the courts? When the president learns that a sewer is leaking, who tells the municipal government? The internet enables dialogue and personalises discourse, but it does not in itself have the capacity to resolve people’s problems.
Social media as a political mechanism also carries other risks for governance. The excess of information transiting on social media and the difficulty of verifying its validity can distort public opinion and, according to research, negatively affect the ability of decision-makers to assess challenges.
We must also consider that decision makers (like many of us) tend to hear what they want to and ignore the rest. So beyond their administration’s principle concerns, leaders may be interested in how many people follow them, but not necessarily in fixing what ails their followers.
Hence, Maduro can seemingly overlook the fact that thousands of Venezuelans are fleeing the country. At the end of the day, his virtual audience remains intact and his TV show still beams out to millions of viewers every Sunday.
Latin America’s #Twitterpoliticking trend might be an entertaining curiosity if it didn’t so clearly reveal the fundamental weakness of the region’s democracies. This failing stems from political systems founded on inequality, social exclusion, illiteracy and elitism. And it’s not something social media can fix.
As I write this on-site at the Australian Astronomical Observatory, home for the next three nights to the BBC/ABC Stargazing Live show, I’m struck by the number of scientists working hard to explain their science to the nation. They’re taking significant time away from their research, sitting in freezing conditions and working incredibly hard to make the science understandable.
Why? Because it matters.
Science, technology, engineering and maths (STEM) are undoubtedly key skill sets for jobs of the future, although the oft-quoted statistic that 75% of the fastest growing occupations rely on these skills needs further research to verify (the citation trail ultimately links to a 2007 US Dept of Education study that doesn’t even mention this).
Yet what is undeniable is that STEM enrolment rates in Australian schools continue to decline, with 50% of NSW high school certificate graduating with no science from school at all. In terms of achievement on international metrics, Australia has stagnated over the past two decades.
Regardless of the job numbers, we need STEM-aware citizens to be able to make informed decisions in a world where science and technology present great challenges and opportunities.
Trying to arrest decline in STEM literacy will take efforts in the education sector, both at school and university, but also as a society. Changing millions of minds requires traditional outreach as well as social media efforts on an epic scale. That’s why shows like Stargazing Live, Todd Sampson’s Life on the Line, and – for those podcasters out there – Cosmic Vertigo, are so important. They make STEM cool.
Science explained differently. Shows like Todd Sampson’s ‘Life on the Line’ help make STEM cool by exploring science and the fundamental laws of physics in an experiential manner.
Making science accessible, and approachable, is also fundamental to the success of that science. Publicly funded research has to let the boss – that is, the taxpayer – see what’s being done with those funds.
Minds aren’t changed overnight, even over three nights with Stargazing, but taking science out of the lab and into the mainstream is something worth tuning in for.
It could also serve as the home base for the Deep Space Transport vehicle Boeing will build to send humans to Mars. The transport system pictured below will have living quarters so spacefarers can endure the lengthy journey. Astronauts can either stay on board or send a lander to the red planet for surface missions.
Both the transport vehicle and the gateway habitat will be powered by solar electric propulsion system, the promising technology NASA used for the Dawn spacecraft and the same one it’s developing further for future Martian missions. Boeing says it plans to launch the habitat in four parts through NASA’s powerful Space Launch System rocket. It expects to start sending to and assembling the Gateway in cislunar space as soon as the early 2020s
The idea of a new planet, the so-called Planet 9, has captured the attention of scientists and the public alike. Likewise, the debate about Pluto’s planetary status inspires support of its new-found “dwarf planet” title in some, but the passionate voices of hearty displeasure in its demotion by others.
The essence of both these topics presents scientists with a unique opportunity – to understand a fundamental, scientific aspect of our Solar System while at the same engaging with a very willing public, eager to understand and contribute.
The possible existence of Planet 9 takes us to the far edges of the Solar System, way beyond the orbit of Neptune to a region known as the Kuiper belt. And citizen scientists can go there too, by joining the Planet 9 search and Stargazing Live.
Why we think Planet 9 exists
Pluto was kicked out of the planet club because it failed one of the definitions of a planet – it had not cleared its path around the Sun. In other words, Pluto is not its own boss.
However, Pluto is not the only dwarf planet – four other confirmed dwarf planets exist, along with multiple candidate and potential dwarf planets, including the notorious Eris, aka “Pluto Killer”. These all lurk in the outer edges of our Solar System, and have been discovered in recent times.
The location and movement of dwarf planets in the Kuiper belt cannot be explained by the objects we know in our Solar System – there must be something else we have not seen. This is where the idea of Planet 9 began, in 2014.
Most of the known Kuiper belt objects tend to lie on one side of the Solar System with orbit at an incline to the plane of our Solar System (where the planets lie). Scientists have theorised that a source of gravity exists, causing this inclined orbit phenomenon – Planet 9. Even new discoveries, objects discovered after the prediction of Planet 9 such as 2015 RR245, also seem to fit within the proposed existence of Planet 9.
The search for Planet 9
Still in 2017, we know very little about Planet 9.
In order for Planet 9 to affect the dynamics of the Kuiper Belt, it must exert enough gravitational influence over these objects. This implies either a small object close in the Solar System, or a more massive object further out. This range of possible existence means it can be anything from an object ten times the mass and four times the radius of Earth, to a “Super-Earth” – objects we regularly find around other star systems.
The chance to do something no human has done in more than 150 years – discover a new planet – has captured the enthusiasm of astronomers across the world. Since the clear prediction of Planet 9 was first made in 2016, a massive effort has been undertaken to find (or refine) where and what Planet 9 may be.
Astronomers are able to predict the sorts of physical measurements Planet 9 would have. For example, it is proposed to be far out, between 300 and 900AU (300-900 times the distance the Earth is from the Sun), and to appear to be 100-1,000 times fainter in an image than Pluto.
These surveys means that the sky has been searched in great detail before the Planet 9 prediction. However, one fatal flaw exists – the lack of coverage in the Southern Hemisphere.
SkyMapper – The Southern Sky Survey
SkyMapper is a 1.35 metre telescope based at the Australian National University’s Siding Spring Observatory, and is being used to conduct the first digital survey of the entire southern sky – the same sky that has not been combed over for Planet 9.
SkyMapper was designed to fill this void, starting the Southern Sky Survey in 2013. However, it was built with a feature that makes it perfect for finding Planet 9 – repeatedly imaging the same patches of sky.
By imaging an area of sky multiple times, we can detect things that move or change – things like Planet 9. But it would mean looking through hundreds of thousands of images.
Sifting through hundreds of thousands of images is a tedious task. A computer algorithm could be written to sift through the images, flagging potential objects for further investigation. However, with the huge parameter space of how and what Planet 9 is, it does not compare to the efficiency of humans.
Citizen science – the relative new field pioneered by groups like Zooniverse which has bridged the gap between scientific research and public engagement – is the answer. Citizen science recruits interested people to contribute to real science questions, like finding Planet 9.
By making the data accessible, members of the public with relatively no background and no special equipment (other than a computer) can participate in finding Planet 9.
With the launch of planet9search.org, members of the public have sifted through nearly 120,000 images in under three days – a task that would take one PhD student working continuously 4 years to do.
An example of an image in this project is provided below.
SkyMapper image of the southern sky. The red, blue, and green dots denote an object that has moved over multiple images – the exact thing citizen scientists have been asked to find.Brad Tucker, Author provided
Engaging the public for help
There have only been two times in human history that a planet has been discovered – Uranus in 1781 by William Herschel, and Neptune in 1846.
In fact, the discovery of Neptune followed a very similar path as that underway with Planet 9. Urbain Le Verrier showed in 1845 that the irregularities in Uranus’ orbit could be explained by an object like Neptune – both in its location and mass. Upon hearing this news, a massive search was undertaken, with the discovery of Neptune coming just a year later.
Astronomy has clashed head on with the public in the past. Galileo, the founder of modern astronomy, not only revolutionised our idea of the Solar System and the Universe, but did so in the face of harsh backlash of society and the Catholic Church.
Now, the public has a hunger for astronomy that is unmatched in other areas of science. And it’s an opportunity we, as scientists, must embrace.
Involving the public means we can show the scientific process in action. We can show that sometimes not having a result means we are testing the hypothesis, informing it, and then refining it – the essence of science. We can share the triumphs and tribulations. We can share the knowledge.
In the end, maybe we will share the discovery of a new planet in our Solar System, Planet 9.
“Robotic systems would face cryogenic temperatures and rugged terrain and have to meet strict planetary protection requirements,” Hari Nayar, of NASA’s jet propulsion laboratory, said in a statement. “One of the most exciting places we can go is deep into subsurface oceans — but doing so requires new technologies that don’t exist yet.” That’s why, as part of its Ocean Worlds Mobility and Sensing study, the JPL has been developing the tools future rovers will need to successfully scout frozen planets and moons.
The first challenge will be making it through the ice. Europa’s frozen crust, for example, is estimated to be anywhere between 6 and 12 miles deep. If NASA underestimates the crust’s thickness, the rover could expend all of its available energy before breaking through, bringing the mission to a quick and inglorious end. So, rather than use conventional “melt probes” which inefficiently radiate heat to bore through ice here on Earth, the JPL is instead is developing a thermally insulated device that employs a chunk of heat-source plutonium to act as the energy source. A rotating blade at the bottom of the probe would chew through the ice below it, pushing the ice chips it produces through the device’s body where they melt against the plutonium. The melt water can then be funnelled back up to the rover for biosignature analysis.
These rovers will also need to traverse the surface, not just burrow into it. The JPL has studied the effects of intense cold and vacuum on ice formation and found that ice actually behaves like grains of sand under such conditions. They pile up into berms and dunes, like the frozen deserts of Mars, only colder. Luckily, NASA’s already got nearly two decades of experience with that sort of strata and should be able to adapt the same sorts of wheels that Spirit and Opportunity utilized.
Saturn’s moon Enceladus is studded with gas vents and fissures, blowing material from the moon’s interior out to the surface. These are ripe for exploration but future rovers are going to need pretty long arms to safely reach down into them. To that end, the JPL is developing a number of grippers that can extend far beyond the 8-foot reach of the Mars rovers. The agency is working on both a foldable boom arm that can pick up objects 30 feet and a projectile launcher that shoots a sampler as far as 164 feet.
But don’t expect to see these systems outside of a NASA lab anytime soon. “In the future, we want to answer the question of whether there’s life on the moons of the outer planets — on Europa, Enceladus and Titan,” Tom Cwik, who leads JPL’s Space Technology Program, said in a statement. “We’re working with NASA Headquarters to identify the specific systems we need to build now, so that in 10 or 15 years, they could be ready for a spacecraft.”
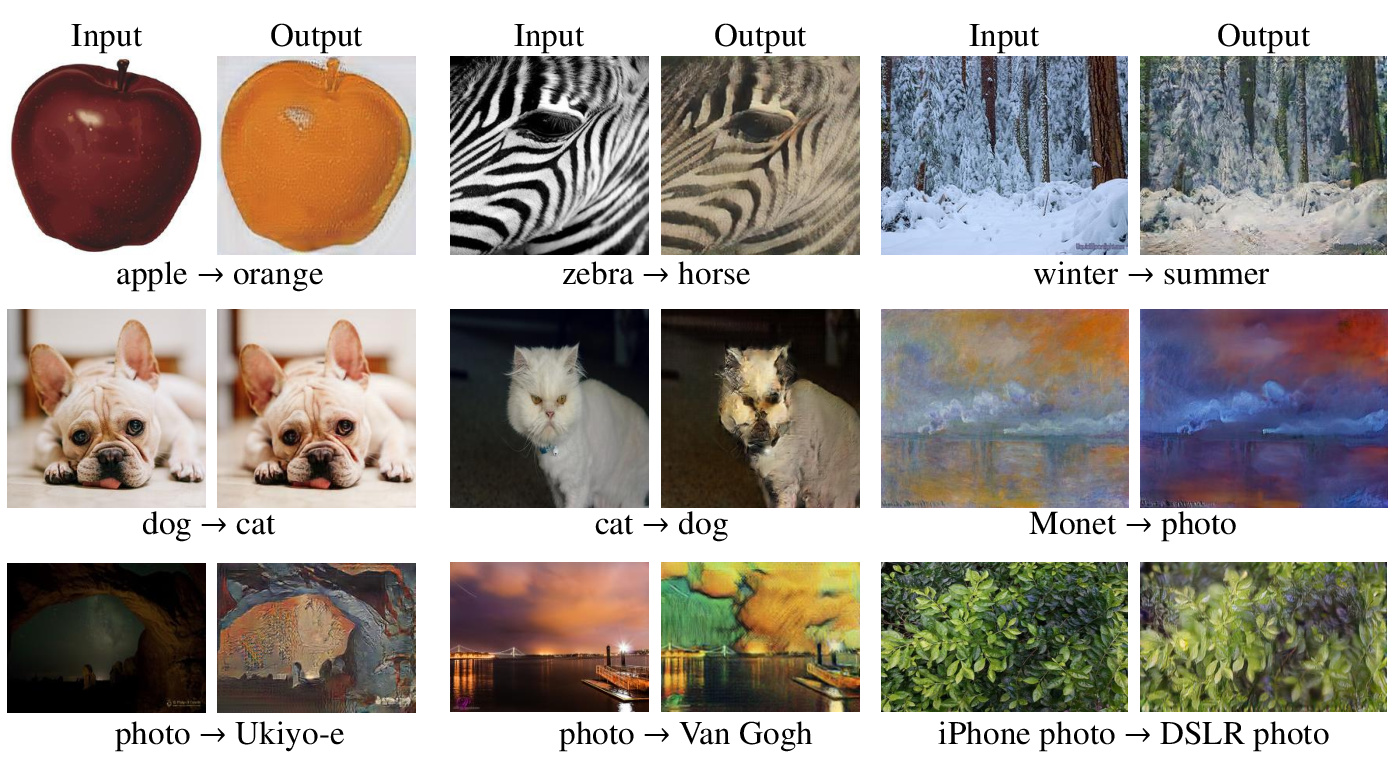
Style transfer has suddenly become a hot thing, apparently, as Adobe recently showed off an experimental app that lets you apply one photo style (’90s stoner landscapes) to another (your crappy smartphone photo).
UC Berkely researchers have taken that idea in another direction. You can take, for instance, a regular photo and transform it into a Monet, Van Gogh, Cezanne or Ukiyo-e painting. The team was also able to use the technique to change winter Yosemite photos into summer ones, apples into (really weird) oranges and even horses into zebras. The technique also allowed them to do photo tricks like creating a shallow depth of field behind flowers and other objects.
The most interesting aspect of the research is the fact that the team used what’s called “unpaired data.” In other words, they don’t have a photo taken at the scene at the exact moment Monet did his painting. “Instead, we have knowledge of the set of Monet paintings of of the set of landscape photographs. We can reason about the stylistic differences between those two sets, and thereby imagine what a scene might look like if we were to translate it from one set into another.”
That’s easier said than done though. First, they needed to figure out the relationships between similar styles in a way that a machine can understand. Then they trained so-called “adversarial networks” using a large number of photos (from Flickr and other sources) and refined them by having both people and machines check the quality of the results.
Ideally, the system would be “cycle consistent.” Just as you hope to have the original sentence when you translate English to French and back again, you want roughly the same painting when you translate a Monet to a photo and back again. In many cases, other than a loss of pixel resolution, the team succeeded in that regard (above).
All is not perfect, of course. Since the algorithms have to deal with a lot of different styles for both paintings and photos, they often fail completely to transfer one to another. As with other systems, one of the main issues is with geometric transformations — changing an apple into an orange is one thing, but attempting to transform a cat into a dog instead produces a very disturbing cat.
The team adds that its methods still aren’t as good as using paired training data either — ie, photos that exactly match paintings. Nevertheless, left on its own accord, the AI is surprisingly good at transferring one image style to another, so you’ll no doubt see the results of their work soon in your Instagram feed. If you want to try it for yourself and are comfortable with Linux, you can grab the code here.
For their system to work, the scientists first treated the grass with a compound that broke it down and made it easier for bacteria to digest. They then treated it with an enriched Clostridium bacteria from the family that makes up the good bacteria in your gut, rather than the one that kills you. Fermentation much like that used for beer produced lactic acid and its derivatives, and further treatment yielded caproic acids. With further processing, that was converted into decane, a primary ingredient of gasoline and jet fuel.
As mentioned, decane and similar products aren’t very clean fuels (they produce CO2 when burned), but they still have a much higher energy density than, say, lithium batteries. As such, be the main fuel used in aviation for the foreseeable future, as jet planes need to be relatively light to get aloft.
For now, the process can only yield a few drops of biofuel, but the researchers claim the process is already relatively efficient, and with some more work, could possibly be made commercially feasible. Unlike corn, grass grows pretty much anywhere, so the ability to convert it into fuel on the cheap would be a huge step.
The scientists used their fresh approach to build three robots that take advantage of this newfound flexibility. One is a cantilever (the “lifter” you see above) that can carry up to 50 times its weight. An accordion bot can expand and contract like a muscle, while a valve can squeeze to act as a pump.
There’s no question that it’ll take a long time to make this method viable for real robots. You’d need an external device to produce the field, for a start. However, the potential uses are already easy to see. The accordion and valve robots would be particularly useful for robots that have to mimic organic functions, not to mention prosthetics, implants and other health care equipment.
The one bright spot was renewable energy. Technologies like solar and wind power put out 7 percent more energy in 2016 than they did a year earlier. The increase isn’t all that shocking, of course. The cost of renewable energy is dropping quickly enough that it’s becoming increasingly practical, particularly for large-scale projects that can power whole urban centers.
This doesn’t mean that the US is losing its clout in energy exports. Those actually increased by 6 percent, a large chunk of which came from a 7 percent spike in crude oil shipments (coal dropped a steep 19 percent). However, the figures suggest that it may be too late to prop up the coal industry. It could be more effective to convert power plants, retrain workers and otherwise prepare for a renewable-focused future.
This isn’t the first time that human stem cells have been used. There was another macular degeneration treatment in 2014. However, the prior example revolved around taking samples from the patient’s own skin. That’s risky when they may be dealing with genetic flaws that could hinder the treatment. So long as the newest procedure proves a long-term success, it opens the door to plucking cells from healthier candidates.
And importantly, there are plans for this to become relatively commonplace. Researcher Shinya Yamanaka is developing a stem cell bank that would give recipients immediate treatment, instead of having to wait months to cultivate cells from a matching candidate. This would only potentially address about 30 to 50 percent of the Japanese population, but that could be enough to improve the quality of life for many people.
The company says it was “shockingly difficult to go from a single core to a triple-core vehicle.” And while it already ironed out most of the issues brought about by using three cores, the demo flight will still be very risky. It’s even loading something silly on board for the test, maybe something sillier than the big wheel of cheese it launched to space aboard the Dragon capsule’s maiden flight in 2010.
SpaceX has to be able to retrieve parts of Falcon Heavy someday if it wants to fulfill its dream of sending humans to colonize Mars on a reusable spaceship called “Interplanetary Transport System.” But for now, it has more attainable goals lined up for the near future, including using more pre-flown boosters, retrieving a Falcon 9’s second stage and relaunching a used rocket 24 hours after its first flight.
Falcon Heavy test flight currently scheduled for late summer
Though more than a million jobs have returned since the 2008 recession, the net loss has devastated the lives of millions of people and their families. Some blame robotics, others globalization. It turns out that those forces work together, and have been equally hurtful to manufacturing jobs. The car industry, for example, imports more and more parts from abroad, while automating their assembly in the U.S.
As a robotics researcher and educator, I strongly advocate that the best way to get those jobs back is to build on our existing strengths, remaining a leader in manufacturing efficiency and doing the hard work to further improve our educational and social systems to cope with a changing workforce. Particularly when looking at what’s happening in China, it’s clear we need to maintain America’s international competitiveness, as we have done since the beginning of industrialization.
That’s a bold goal, especially given the current state of robotics. At present, robots are good only at highly repetitive tasks in structured environments. They are still far inferior to humans in simple tasks like picking items from a shelf. But FoxConn’s goal of transforming its streamlined manufacturing line is definitely achievable. Many of the tasks now done by humans thousands of times a day can be easily automated – such as applying a puddle of glue, placing double-sided tape, positioning a piece of plastic, tightening screws or loading products onto a pallet.
Taking apart and reassembling an iPhone.
The lesson here is simple: Some occupations will simply disappear, like those of weavers in the textile industry displaced by the power loom. We need to embrace this disruption if we want to avoid being taken out of the game altogether. Imagine if China is able to replace our low-wage jobs with its workers, and then can automate those jobs: Work Americans now do will be done here, or anywhere – but not by humans. FoxConn is planning its first plant in the U.S.; soon, Chinese robots will be working in America.
Seeing opportunity, not loss
The good news is that while many types of jobs will cease to exist, robots will create other jobs – and not only in the industry of designing new robots.
This is already beginning to happen. In 2014, there were more than 350,000 manufacturing companies with only one employee, up 17 percent from 2004. These companies combine globalization and automation, embracing outsourcing and technological tools to make craft foods, artisanal goods and even high-tech engineered products.
Many American entrepreneurs use digitally equipped manufacturing equipment like 3-D printers, laser cutters and computer-controlled CNC mills, combined with market places to outsource small manufacturing jobs like mfg.com to run small businesses. I’m one of them, manufacturing custom robotic grippers from my basement. Automation enables these sole proprietors to create and innovate in small batches, without large costs.
Returning to manufacturing dominance
This sort of solo entrepreneurship is just getting going. Were robots more available and cheaper, people would make jewelry and leather goods at home, and even create custom-made items like clothing or sneakers, directly competing with mass-produced items from China. As with the iPhone, even seemingly complex manufacturing tasks can be automated significantly; it’s not even necessary to incorporate artificial intelligence into the process.
Three trends are emerging that, with industry buy-in and careful government support, could help revitalize the U.S. manufacturing sector.
First, robots are getting cheaper. Today’s US$100,000 industrial robotic arms are not what the future needs. Automating iPhone assembly lines will require cheap robotic arms, simple conveyor belts, 3-D-printed fixtures and software to manage the entire process. As we saw in the 3-D printing industry, the maker movement is setting the pace, creating low-cost fabrication robots. The government is involved, too: The Pentagon’s research arm, DARPA, has backed the OtherMill, a low-cost computer-controlled mill.
In addition, more people are programming robots. Getting a robot to accomplish repetitive tasks in industry – for example, using Universal Robot’s interface – is as simple as programming LEGO Mindstorms. Many people think it’s much harder than that, confusing robotic automation with artificial intelligence systems playing chess or Go. In fact, building and programming robots is very similar both physically and intellectually to doing your own plumbing, electrical wiring and car maintenance, which many Americans enjoy and are capable of learning. “Maker spaces” for learning and practicing these skills and using the necessary equipment are sprouting across the country. It is these spaces that might develop the skill sets that enable Americans to take automation into their own hands at their workplaces.
Lastly, cutting-edge research is improving the hardware needed to grasp and manipulate manufacturing components, and the software to sense and plan movements for assembling complex items. Industrial robot technology is upgradeable and new robots are designed to complement human workers, allowing industry to make gradual changes, rather than complete factory retooling.
A path forward
To fully take advantage of these trends and other developments, we need to improve connections between researchers and businesses. Government effort, in the form of the Defense Department’s new Advanced Robotics Manufacturing Institute, is already working toward this goal. Funded by US$80 million in federal dollars, the institute has drawn an additional $173 million in cash, personnel, equipment and facilities from the academic and private sectors, aiming to create half a million manufacturing jobs in the next 10 years.
Those numbers might sound high, but China is way ahead: Just two provinces, Guangdong and Zhejiang, plan to spend a combined $270 billion over the next five years to equip factories with industrial robots.
The stakes are high: If the U.S. government ignores or avoids globalization and automation, it will stifle innovation. Americans can figure out how to strengthen society while integrating robotics into the workforce, or we can leave the job to China. Should it come to that, Chinese companies will be able to export their highly efficient manufacturing and logistics operations back to the U.S., putting America’s manufacturing workforce out of business forever.


